| |
|
|
|
|
|
|||||||||||||||||||||||||||||||||||||||||||||||||||||||||||||||||||||||||||||||||||||||||||||||||||||||||||||||||||||||||||||||||||||||||||||||||||||||||||||||||||||||||||||||||||||||||||||||||||||||||||||||||||||||||||||||||||||||||||||||||||||||||||||||||||||||||||||||||||||||||||||||||||||||||||||||||||||||||||||||||||||||||||||||||||||||||||||||||||||||||||||||||||||||||||||||||||||||||||||||||||||||||||||||||||||||||||||||
| Worldwide Exposure Standards for Mold and Bacteria (Excerpt)
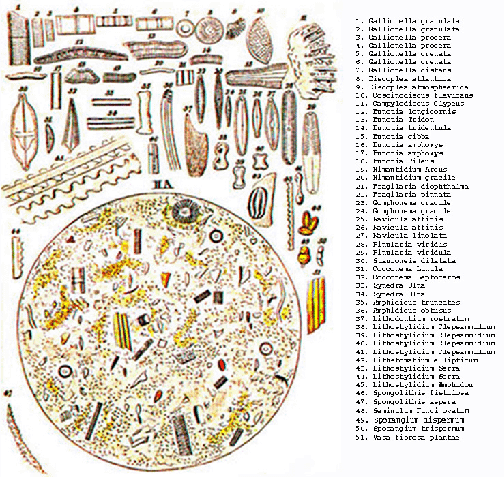
HISTORICAL INFORMATION ON MOLD AND BACTERIA A. ANCIENT KNOWLEDGE OF MOLD AND BACTERIA 1. Beneficial and Medicinal Uses The recognition of the potential health problems related to mold and bacteria exposure is not a new subject in human history. Ancient Persians recognized the antimicrobial properties of honey. According to legend, in 323 B.C.E., Macedonia’s Alexander the Great was buried in a vessel full of honey where his body remained intact for over 1,000 years until it was stolen. 379 Ancient Egyptians also knew about the antimicrobial properties of honey and their treatises on medicine recommended the application of honey to a wound to minimize the risk of infection. 118, 376 The Nahua Mesoamerican Indian cultures in ancient times recognized the medicinal and psychotropic effects of mushrooms.349 These fungi are still used in some of their religious ceremonies today. Beer, wine and bread making are probably the earliest beneficial uses of mold and bacteria by mankind. Though the dates of discovery of these processes predate much of recorded history, the Bible also contains a reference on the recipe for making honey wine. It clearly makes note of the fermentation process. Bread making, with the use of the “starter” pot for yeast that makes the bread rise, certainly predates the ancient Egyptians. The starter pot contained a small portion of flour and water that was constantly growing yeast. Every day, a small portion was added to the daily batch of bread to make it rise. A similar amount of fresh flour and water was added to replenish the starter pot. The making of cheeses with different bacteria appear to date to the time of the domestication of cattle in Europe and Asia during the Stone Age. These early fermentation techniques were a way of preserving food since no refrigeration existed until the 20th century. The processes for making wine, cheeses, sauerkraut and other fermented foods were also present in early Roman times. 2. Construction Techniques Leviticus in the Old Testament contains a lengthy discussion of how to test for mold growth in a dwelling, how to remediate it and even how to dispose of mold-contaminated building materials. This biblical passage follows: Old Testament c. 1513 B.C. LEVITICUS 14 “If (the priest) finds greenish or reddish streaks in the walls of the house which seem to be beneath the surface of the wall, he shall close up the house for seven days and return the seventh day to look at it again. If the spots have spread in the wall, then the priest shall order the removal of the spotted section of the wall, and the material thrown into a defiled place outside the city. Then he shall order the inside walls of the house to be scraped thoroughly and the scrapings dumped into a defiled place outside the city. Other stones shall be brought to replace those that have been removed, new mortar used and the house replastered.” It was well known by the Spanish conquerors in the New World that brick covered with “white wash,” or lime-based plaster, would prevent mold growth on buildings in humid climates. If mold growth appeared, then a new layer of plaster would be applied (as in Leviticus). This clearly was a construction technique developed over the millennia, the significance of which was common knowledge. Interestingly, this time-honored construction technique has given way in the US to drywall systems that are much more mold-friendly. The builders of Vienna, Italy, learned hundreds of years ago how to build buildings that would not rot or support mold in this city with water canal streets. Water-tolerance of construction materials was essential to the development of this city. An interesting insight into mold prevention in the US in the 1800’s, Mark Twain wrote about white-washing a fence in his fictional novel “Huckleberry Finn.” Apparently, homeowners were aware of the benefits of “white wash” wood fencing in sweltering southern climates. 3. Health Effects An interesting historical record on the potential health effects of mold is found in Marcus Vitruvius Pollio’s “de Architectura.” 267 In Chapter 1, he discussed the stature and voice of people throughout the Roman Empire. He makes an interesting comment about people “in cold countries, which are distant from the south, the moisture is not drawn out by the heat, but the dewy air, insinuating its dampness into the system, increases the size of the body, and makes the voices more grave. … (T)he northern most nations, oppressed by a gross atmosphere, and cooled by the moisture of the air, are of duller intellect.” Was he describing people with an asthma body compensation such as asthma lung (barrel chest), people whose voices are deep in tone due to allergy congestion or people afflicted with neurological problems from mycotoxin or MVOC exposure? Unfortunately, the Dark Ages resulted in the loss of much of this early knowledge. Only after the bubonic plague and the Renaissance did scientific investigation begin again and the theories surrounding infections begin to be researched. 4. The Mummy’s Curse Another interesting story about mold exposure relates to the story of the “Mummy’s Curse. ” This relates to the many deaths associated with archeologists opening old Egyptian tombs. For example, Lord Carnarvon, who opened King Tut’s tomb in 1922, died a few months later. A more recent extreme example occurred in Poland in 1973. On April 13, 1973, 12 archeologists opened the tomb of King Casimir. Within a few days only 2 of the researchers were still alive. One of the remaining survivors performed microbial examinations of the tomb. This researcher found Aspergillus flavus, Penicillium rubrum, and Penicillium rogulosium. These fungi and possibly their mycotoxins are believed to be responsible for the death of the 10 researchers. B. HISTORICAL CASES OF MOLD INGESTION TOXICITY Mold growth on stored foodstuffs for both human and livestock consumption has been a concern for hundreds, if not thousands, of years. The old cliché “Make hay while the sun shines” underscores the wisdom of harvesting foodstuffs while they are dry to prevent future mold growth during storage. 1. Ergot Poisoning / St. Anthony’s Fire Probably the oldest case on record of mold ingestion toxicity dates to 55 B.C. in Denmark. The body of a man called “Tolland Man” was preserved in mud in a swamp for over 2,000 years. 302 The well-preserved body showed signs of a very violent death. It appears that he was first strangled and then his throat was cut. Investigators wondered about the circumstances leading up to his death. Further investigation revealed traces of Claviceps purpurea in his stomach. This is the fungus that produces the mycotoxin that causes ergot poisoning or ergotism. Ergot poisoning causes psychotic behavior in individuals who inadvertently ingest it in moldy foodstuffs. A sudden onset of psychotic behavior may have led to his untimely and violent death. (Modern research has shown the ergot contain lysergic acid amines. One of these amines is known as LSD.) In Medieval times, ergot poisoning was known as St. Anthony’s Fire. In the year 994 alone, over 40,000 people died of the affliction. In the 13th century the Mongol invasion of Russia was stopped by the numerous deaths of Tartar horses from mold contaminated grain taken from Russian stores. In 1777 in France, 8,000 people died of gangrenous ergotism.109 Professor Mary Matossian, 228 expanding on this ergot poisoning research, studied seven centuries of demographics, weather, literature and crop records in Europe. She found that throughout Medieval history, drops in population have followed diets of rye bread and damp weather. A diet containing ergot mycotoxins from Claviceps purpurea and species of Fusarium have been shown to reduce the immunity system. Interestingly, during the early years of the bubonic plague in Europe, from 1348 on, conditions were ideal for ergot fungus growth. Many symptoms of ergotism and the plague are similar. Matossian hypothesized that the worst plague outbreaks occurred where there was more rye in the local diet and hence, more ergot poisoning present in the population. The suppressed immune system of the affected population could have led to the major regional variations in the death rates attributed to the plague. The next major historical record of mold toxicity occurred in Salem, Massachusetts in 1693 and 1694. In the book “Ergotism: The Satan Loosed in Salem?” Linda Caporael 85 suggests that the visions purported to have been experienced by the Salem women and the frenzied response of others in the famous witch hunts were likely to have been caused by ergot-tainted rye bread. There were probably no witches to speak of, and when the supply of infected grain ran out, the people returned to a normal more passive nature. Interestingly, an amateur meteorological journal kept by a local Salem official noted that the springs of 1693 and 1694 were especially rainy and would have been conducive to the growth of the ergot fungus on the locally grown grain used to make rye bread. An interesting quote from the historical record 85 of this period states: “Tituba and her husband John Indian were asked to bake a witch cake – made from rye soaked in the accused’s urine – which was then fed to a dog. The dog became bewitched and died, thus proving the guilt of the accused.” Clearly, the ergot poison level in these individuals was so high that the ergot excreted in the urine was sufficient to kill a dog! In the last two centuries, St. Anthony’s Fire has appeared again, although usually associated with famines during which people had to eat tainted food just to survive. This was the case in the Russian epidemic of 1888. 228 Again in the 1930’s, Russia and the Ukraine experienced another outbreak of St. Anthony’s Fire. While the United States suffered during a Dust Bowl, Russia and the Ukraine had the opposite problem. Excessive frequent rain led to considerable crop contamination problems due to excessive moisture. The result was serious mold growth on both human and livestock grain crops. Thousands of animals died, though no human deaths are noted. This is most likely due to the selection of the unmoldy grains for human consumption. The most recent highly publicized ergot poisoning case occurred in August 1951 in Point St. Esprit, a small town in France. The townspeople were contracted ergot poisoning after a local bakery sold rye bread contaminated with ergot mycotoxin. Four people died. Interestingly, as part of this incident, it was reported that a large number of townspeople also suffered “possession” or “bewitchment.” Even though public health authorities seized the rye and explained to the public what the real cause of the disease outbreak was, many people still believed that the bakery was actually possessed by the devil. Consequently, to assuage the townspeople’s fears, the bakery was exorcised by the local church bishop. Victims of this event, still alive today, recall the symptoms: “Thousands of pin pricks on the skin,” Not surprisingly, these symptoms matched the description of the sensations and visions of the ill-fated “witches” in Salem, Massachusetts, over 250 years earlier. Note: This is again, one of those cases of “If you do not learn from history, you are destined to repeat it.” In this case, the townspeople were embracing the same “possession” or “bewitchment” beliefs of the 17th century. It is difficult to believe that the concept of ingestion toxicity was still not universally understood in 1950. 2. Stachybotrys Mycotoxins Drobotko 113,114 conducted significant and extensive research into the identification of the particular mold species responsible for such animal deaths. The research described in detail the animal symptoms and the amount of dosage necessary to kill the animals. This research identified Stachybotrys atra (now known as chartarum) as the mold species responsible for the adverse health effects. This research was the first recognition of the potential health effects of the mycotoxins produced by Stachybotrys atra and the development of the medical diagnosis of Stachybotryotoxicosis. Russia continued research into the health effects of this mold throughout WWII. This research became critical during WWII, when people were eating more marginal grain crops and increasing numbers were dying of Stachybotryotoxicosis. One estimate was that 20,000 Russians died from Stachybotryotoxicosis during WWII. A major breakthrough occurred during this time when it was found that mixing moldy grains with caustic chemicals such as ammonia detoxified the Stachybotrys mycotoxins and saved thousands of human and animal lives. In fact, most of what we know today about Stachybotrys and its mycotoxins comes from this Russian research. Note: This research appears to indicate that ammonia can be used when remediating Stachybotrys-contaminated building materials to actually inactivate the mycotoxins. However, given that bleach and other oxidizing chemicals are routinely used in mold remediation and the dangerous chemical reaction of bleach and ammonia, this may not be prudent. The concept of inactivation of mycotoxins may be worthy of further research. C. HISTORICAL SAMPLING RESULTS AND METHODS The presence of mold spores in the air was well known in the early 19th century. Ehrenberg’s illustration of dust in the air collected in 1833 by Charles Darwin on the Cape Verde Islands is shown on the next page. This hand-drawn illustration depicts items he saw microscopically which can be easily recognized as various common mold spores. Many of the spores that are captured in a total spore sample collected today such as Sporangium are fairly recognizable in the Ehrenberg picture. In the mid 19th century, Pasteur and other scientists developed the microbial theory of disease. This led to extensive research into the existence of microorganisms in food, water and the environment. Bacteria and molds were studied for their various genera and reproductive techniques. Studies were conducted in the Paris subway, hospitals, the countryside and urban areas. Though most of the information was limited to general observations, it opened the door to causative mechanisms for disease as opposed to the concept of “being punished” or “being tested” by one’s God. This early work was based on the recognition of visible colonies of mold or bacteria that would grow on various materials, hence, the development of the term “colony-forming unit” or “cfu.” This naming convention continues today with the addition of a sampling volume or area, such as cfu/m3 or cfu/in2. Ehrenberg Drawing of Microscopic Dust Collected by Darwin from Cape Verde Islands, 1833
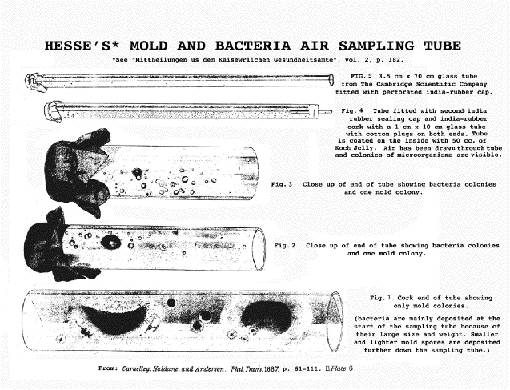
1. Culturable Spore Testing a. Hesse’s Agar Coated Glass Tube In 1885-6, Carnelley, Haldane and Anderson 86,120 conducted extensive research into mold and bacteria in the air of British schools and public housing. They published a technical paper in 1887 titled “The Carbonic Acid, Organic Matter, and Micro-Organisms in Air, More Especially of Dwellings and Schools.” This work was clearly ground-breaking in the field of indoor air quality. The research was well conducted and showed the benefits of mechanical ventilation in reducing indoor levels of microorganisms. Carnelley, et. al. recommended a combined mold and bacteria “purity” standard for indoor air of 600 cfu/l or 20,000 cfu/m3. This is about 3-4 times the maximum levels recommended today by Finland and Poland. This is discussed further in Section a. vi. below and in Chapter 3 Section G. The work involved the use of the first air-monitoring device that quantified both culturable bacteria and mold levels in organisms per liter of air at the same time on the same media. The air sampling device was invented by Hess of Germany in 1861. 86 He pioneered air microbiological monitoring that sampled a known volume of air. This method used a 3.5 cm diameter by 70 cm long glass tube coated with a Koch jelly on the inside. Koch jelly was composed of 1 lb. meat juice, 10 gm. of peptone, 5 gm. NaCl, and 50-100 gm. of French leaf gelatin to 1 liter of water. The mixture was heated and slightly over-neutralized with sodium carbonate. 50 cc of the mixture was poured into the tube and rolled to coat the inside and after replacement of the cork, the tube was heated in a steamer (potato cooker) to 100°C for at least 1 hour. Approximately 0.5 liters of air was drawn through the tube in “bad atmospheres,” 1-2 liters in better-ventilated rooms and up to 10 liters in outside air, depending on the circumstances. Sampling height was 3 feet. The flow rate was 333 milliliters per minute. The tubes were then left to grow for 3-4 weeks at room temperature until no new colonies appeared. (At that time room temperature was probably 60-70 °F based on the information in the research.) The number of colonies was then counted. Interestingly, most bacteria were deposited at the beginning of the tube, because of their large size and weight, while mold spores were deposited further down on the tube. The diagram on the next page shows pictures of the Hess’s glass tube microbial sampler as shown in the Carnelley, et al. research. i. Mold and Bacteria in Outside Air Samples Carnelley, et al. took outside air samples in the towns of Perth and Dundee during the winter and spring of 1885-86 at the same time they were examining schools and housing. Just like today, they found virtually non-detectable levels of mold and bacteria in the outside air in the wintertime in non-urban areas. However, they did detect an average concentration of 600 cfu/m3 of bacteria and 200 cfu/m3 of mold in town streets of Dundee (14 samples.) Similar levels are typically found today. ii. Mold and Bacteria in Outside Air Samples - Day and Night Difference Carnelley et al. were aware of the difference that day and night sampling produced, similar to the work by Kendrick (Grana 34, 1995) over 100 years later. The table on page 8 shows the sampling results of 6 tests in the center of the town of Dundee during April and May of 1886.
TABLE 1 : OUTDOOR AIR MOLD AND BACTERIA LEVELS
Carnelley et al. also had the opportunity to monitor the Houses of Parliament during April and May of 1886 during the day and night. The table below shows the sampling results: TABLE 2 : HOUSES OF PARLIAMENT MOLD AND BACTERIA LEVELS - 1886 (in cfu/m3)
This data is interesting according to Carnelley, et al. in that it showed the impact of human activity in stirring up dust in an indoor environment that contains mold and bacteria. This was in the days before vacuum cleaners, so everything was only broom clean unless the floor was washed. Based on Carnelley, et al.’s work, the only places that seemed to wash the floors were hospitals. iii. Mold and Bacteria in Air in Different Types of Houses Carnelley et al. was aware of the differences in health amongst the poor, working class, and the wealthy in England. Their paper lists the death rate differences between the various socioeconomic groups. The poor were dying at rates almost twice that of the wealthy. Carnelley et al., and Miquel of France felt that a major reason for this difference was diseases resulting from poor air quality. The following table from Carnelley et al. shows the differences in micro-organism levels by type of housing. TABLE 3: MOLD AND BACTERIA LEVELS BY CLASSES OF HOUSING - 1886 (in cfu/m3)*
*”the number of microorganisms in the outside air were so small, they may be neglected.” As one can see in the above table, Carnelley et al. had some microbiological justification for their opinion on disease rates being related to indoor microbial levels. There was also a relationship to the density of people per housing unit. iv. Mold and Bacteria in the Air of Schools Carnelley et al. also looked at the levels of airborne mold and bacteria in schools. They looked at their data in three different ways - naturally-ventilated versus mechanically-ventilated schools, boys versus girls schools and levels of cleanliness. Each of these tables is shown below and on the next page. TABLE 4 : MOLD AND BACTERIA LEVELS IN SCHOOLS WITH DIFFERENT VENTILATION - 1886 (in cfu/m3)
Clearly, the above data by Carnelley et al. showed that mechanical-ventilation (supplying outdoor air) was essential to lowering indoor microbial levels. Next, Carnelley et al. noted the difference between boys and girls schools. TABLE 5 : MOLD AND BACTERIA LEVELS IN BOYS AND GIRLS SCHOOLS - 1886
Carnelley et al. stated that boys were less clean than girls and consequently more bacteria was present in boys’ classes. Carnelley et al. also looked at the impact of the level of housekeeping in both homes and schools on mold and bacteria levels. This is very interesting data that may warrant further considered during microbial investigations. TABLE 6 : TOTAL MOLD AND BACTERIA LEVELS IN SCHOOLS AND HOMES
v. Mold and Bacteria in The Air of Hospitals Carnelley et al. also looked at the levels of mold and bacteria in hospitals. Carnelley noted that during his sampling the windows were open about 1”. What is very interesting in this sampling is that the bacteria level was much lower than the mold spore levels. This was just the opposite of all of his other sampling results. The use of disinfectants in hospitals was widely practiced at this time. Further, housekeeping in hospital, no doubt, was far superior than in other building. The table of their sampling results is shown below : TABLE 7 : MOLD & BACTERIA LEVELS, DUNDEE ROYAL INFIRMARY - 1886 (in cfu/m3)
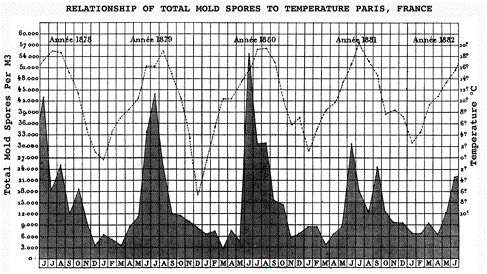
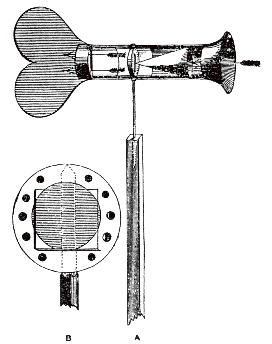
0 = Not detected. The calculated LOD for Hesse’s sampling device (for a 10 liter sample) would be <1 cfu/10 liters or <100 cfu/m3. vi. Standards for Air Purity Lastly, Carnelley et al. proposed purity standards for mold and bacteria in indoor air. Their standards called for: Total microorganism (mold and bacteria) not to exceed 20,000 per cubic meter where the ratio of bacteria/mold should not exceed 30. Therefore, applying this ratio, the maximum permissible of level of bacteria would be 19,355 cfu /m3 with a mold spore level 645 cfu/m3. As stated earlier, the levels recommended in this air purity standard are about 3-4 times higher than the respective recommended levels today. (e.g. bacteria ratio: 19,355/4,500 ~ 4 and mold ration: 645/200 ~ 3). See Chapter 3 for a discussion of current recommended bacteria and mold exposure standards and guidelines. Another widely used method of mold and bacteria monitoring at that time was the settling or open plate deposition (OPD) method. This method for monitoring of mold and bacteria dates to, at least, the beginning of the 19th century. No specific date is easily found in the literature. However, a reference to mold and bacteria monitoring using the OPD method in a home in upstate New York in 1834 120 revealed mold and bacteria levels typical of what could be found today. The growth media used in OPD sampling have somewhat changed over the years. During the 20th century growth media included beef blood, grape juice and potato starch. Interestingly, the data from this early work is very similar to results one sees with today’s culture media. This OPD method is still in use in some industries today, over 150 years later, due to its simplicity and low cost. 2. Total Spore Testing The first documented method for analyzing total spores in the air was the Aeroconiscope developed in Europe by Maddox and Cunningham around 1840. 145 This device used wind pressure to deposit spores on a sticky slide that was then examined microscopically. This device is shown in the picture on the following page. It used a sticky slide (Diagram B) to collect impacted spores. However, the device was dependent upon wind speed for impact energy. This limited the collection efficiency of the device. This device was used in the 1870’s by British physicians to study the spread of cholera in Calcutta, India. In 1879, Pierre Miquel296, following air testing device work by Schoenauser, developed a method of actively sampling mold spores in air. 145 The main purpose of Miquel’s research was to determine if there was a relationship between airborne microbial levels and the various disease ‘epidemics’ (typhoid, cholera, etc.) that were affecting people in Paris. Miquel used a glycerin-coated glass slide that was placed horizontally. Air was impacted onto the slide after passing through a 0.5 mm orifice. Air was drawn through this orifice using a water-operated pump at 20 liters per minute (very similar to the Air-O-Cell spore strap used today). Miquel found airborne mold spore levels 100 times higher with this device than with the Maddox and Cunningham wind-operated spore trap method. In a park near Paris, Miguel measured as many as 54,000 fungal spores per cubic meter in June of 1880. This level of total mold spores is very close to what one could find today using more modern equipment. Miquel’s outdoor mold spore sampling results from Paris (June 1878 to June 1882) along with concurrent ambient air temperature readings are shown in the graph on the next page. Total Mold Spore Measurements Collected by Miquel in the late 1880’s
Drawing of Maddox and Cunningham Wind Driven Mold Spore Sampling Device
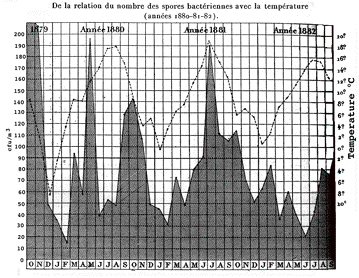
In performing his microbial sampling, Miquel used a method similar to a liquid impinger. He drew a known volume of air through a sterile liquid media of Liebig’s extract. (A product of the Liebig Extract Meat Company established in London in 1865). Liebig's meat extract is a molasses-like black spread containing only reduced meat stock and salt (4%). It took 3 kg. of meat to make 100 g. of extract. Miquel diluted Liebig extract to a specific gravity of 1.024. Initially, Miquel found bacteria levels so high that he could not count them microscopically. Subsequently, the samples were diluted prior to analysis. Miquel counted and extrapolated his analysis results to get a reliable estimate of the airborne concentration of microorganisms. This method produced results similar to the work by Carnelley, et al. using Hesse’s tube. Miquel’s research included both airborne total spore and bacteria levels in relation to season, weather, district and altitude. The graph below shows some of the bacteria levels that Miquel measured from October 1879 to September 1882 along with concurrent ambient air temperature readings. Bacterial Levels Measured by Miquel as Compared to Temperature and Season – Late 1880’s
In a related study, Miquel compared airborne microbial levels in a hospital to that in a sewer. Interestingly, the sewer air was 40-50 times cleaner than the air collected in hospitals! Miquel collected and analyzed some 10,000 samples over his career. Miquel’s work and data were published in his book Organimes Vivants De L’Atmosphere415 in 1883. This comprehensive book is over 200 pages in length and similar to texts on the subject of indoor air today. It included a comprehensive review of all of the air monitoring instrumentation used at that time and the relationship between weather, bacteria and mold spore concentrations and the incidence of disease. Miquel’s work also included a list of disinfectants being used in disease prevention and efficacy testing results. D. TURN OF THE CENTURY AMBIENT MICROBIAL LEVELS Culturable Testing Widespread research into mold and bacteria levels in the indoor air was conducted in the early 20th century in England and France. Research was probably also conducted in Germany, Russia and other countries, but language barriers have impeded direct access to this literature as of the publication date of this document. The following table shows a summary of some of the bacteria levels that were measured in the late 19th century. The testing methods are not specified, however, we do know that Miquel and Hesse used the volumetric methods described above. (Unfortunately, the referenced work by Soper and Tenon could not be found in US libraries.) TABLE 8 : APHA DATA ON MOUTH STREPTOCOCCI AS AN
90. PHILOSOPHICAL TRANSACTIONS OF THE ROYAL SOCIETY, CARNELLEY, HALDANE, & ANDERSON, 1887, VOL. CIXXVII, 178 P. 61. The US Public Health Service began studying bacteria levels in schools in the 1910’s, almost 20 years after similar work began in Europe. Starting in 1914, the US Public Health Service began publishing data in its journal about bacteria levels in the United States. Some of this early data is shown in the following tables: TABLE 9 : US HISTORICAL DATA ON BACTERIA IN THE AIR 13
TABLE 10 : US HISTORICAL DATA ON BACTERIA IN THE AIR (Gelatin Media) 13
The concern over the spread of tuberculosis, influenza and streptococcus led to expanded testing for these agents in public places. Numerous air testing studies showed widespread existence of streptococci and tuberculosis bacteria in schools and public places. In 1910, the American Public Health Association (APHA) 15 stated that “mouth streptococci (were an) indicator of indoor air pollution.” Mouth streptococci were easily identified using the open plate deposition sampling method. The following table shows some of the early data: TABLE 11 : APHA DATA ON MOUTH STREPTOCOCCI
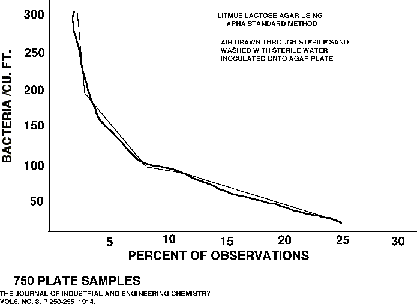
Note: In another example of repeating unlearned history, strep throat is still a public health concern that frequently affects children in school. However, due to the availability of antibiotics, we, as a society, are no longer highly concerned about airborne transmission of Streptococci in schools because this illness has been easily treatable until recently. Unfortunately, antibiotic-resistant forms of Streptococci have been appearing. The spread of these drug-resistant Streptococci could lead to a “revisiting” of the airborne transmission issue that was identified almost 100 years ago. The following graph shows bacteria levels found in 750 school samples taken in the 1910’s. The distribution of data is similar to what is found in surveying school buildings today. Generally, less than 10% of the samples have readings that are significantly elevated. The potential implications of this data are that the percent of today’s buildings with design, construction or maintenance defects seems similar to what it was almost 100 years ago. Airborne Bacteria Levels in Schools – Circa 1914 62
62. THE JOURNAL OF INDUSTRIAL AND ENGINEERING CHEMISTRY, VOL. 6, NO. 3, P. 250-255, 1914. The US Public Health Service published in its journal in March 1915 13 (pg. 253), its first “Standard Methods for the Examination of Air” for sampling bacteria. These methods involved drawing a known volume of air through sterile sand, then washing the sand with sterile water and depositing the water on agar plates to grow colonies. One of the interesting papers by Huddleson 170 cited in this method, compared horizontal and vertical plate sampling results that are provided in the following table. This paper showed that gravity settling was a major factor affecting the sampling results, the implication of which is may applicable today. For example, sampling the air for bacteria or mold spores and the sample inlet is open on the top (like an Andersen N-6) could give higher results than if the sample inlet is on the side, such as in holding an RCS, SAS or MAS-100 sampler horizontally. This subject needs to be researched further using current sampling equipment and media. Note the two sampling times in the different columns in the table on the next page and the differing results. Over the next few years, a 10-minute exposure for the settled plate method became accepted practice. A similar sampling period is used for most bioaerosol monitoring today. Note: In another case of repeating unlearned history, no manual for bioaerosol sampling makes note of this important sampling position variable. The assumption is made that with volumetric sampling, airflow direction is not significant for bioaerosols. However, in sampling many types of particulates in industrial environments, personal samplers have to be hung with the inlet in the downward position so that gravitational settling effects are avoided. Clearly, this factor identified in early bioaerosol sampling may not be receiving adequate consideration today. TABLE 12 : BACTERIA OF THE AIR IN AN AMUSEMENT HALL 170
The interest in mold and bacteria as the cause of disease included more general research on indoor air quality (IAQ). Many of the early IAQ investigations were motivated by economic and social reform. It was well known in the 1800’s that people living in substandard housing were far sicklier and died more frequently than people living in larger, upper-class homes. Establishing the reasons for these health problems and the methods for correcting this social problem was researched in England, Germany and France in the late 19th century. The first indoor air quality standard for carbon dioxide of 1,000 ppm was proposed in Germany by Max Van Petterkofer in 1858.90,120 (Germany was also the first country to ban lead in paint in the mid 1800’s and asbestos insulation in 1943, in the middle of a war.) A similar carbon dioxide standard was proposed in France in 1875 by F. de Chaumont. 90 Carnelley, et al. also proposed a carbon dioxide “air purity” standard in 1887 of 1,000 ppm. Chaumont also proposed a ventilation standard of 50 cfm per person. Morin, in the English Barracks Improvement Act of 1861, required specific ventilation standards to reduce the public health risk of disease. These ventilation standards are summarized in the following table. The similarity to today’s ventilation standards is amazing. TABLE 13 : ENGLISH BARRACKS IMPROVEMENT ACT OF 1861 –
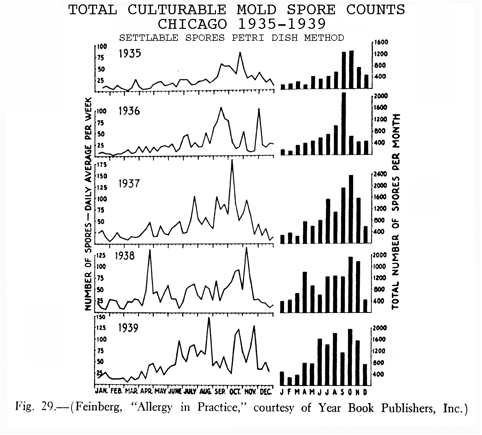
By 1924, over 60 years after the enactment of the English ventilation standards by Morin, 30 cfm per student of fresh air was embodied into law in 21 US states by statutes and board regulations. 224 2. Total Spore Testing The theory of allergy as a disease began to evolve in the 1930’s. Consequently, routine measurement of total mold spore levels began to be conducted in many major cities in the US throughout that decade. The method used was mainly a glass slide coated with petroleum jelly that collected settled spores from the air. Slides were exposed between five minutes and 24 hours, depending upon the research being conducted. The slides were then examined microscopically. This work developed into the profession known today as the aerobiology. Many aerobiologists are members of the Pan-American Aerobiology Association (PAAA). Although these professionals have been studying mold spores in the indoor and outdoor environments for decades, only within the last 10 years has the significance of indoor microbial levels received more attention in the public health arena. Feinberg, during the 1930’s, conducted sampling for mold spores in numerous major cities in the US. He mainly quantified Cladosporium (aka Hormodendrum ca. 1930) and Alternaria because he considered these to be related to allergy. This data was later published in a book by Tuft. Feinberg conducted his most detailed research in Chicago. The chart on the next page shows illustrates of the weekly outdoor mold spore levels in Chicago in the mid 1930’s. Interestingly, the total mold spore levels that were measured in the mid 1930’s are similar to those found today, more than 70 years later. Note the seasonal and year-to-year variation, also typical of what is found today. Unfortunately, most of the early indoor air quality and ventilation research from the late 19th and early 20th centuries was forgotten or ignored in the United States by WWII. The reasons for this are not clear. However, the research into biowarfare agents that started in the 1940’s in the United States may have had something to do with the apparent inaccessibility of this information. Weekly Outdoor Mold Spore Levels in Chicago in the Mid-1930’s
Note: This is another case of not learning from history. Clearly, the relationship between allergy symptomatology and mold spore levels has been known and well recognized for decades. Controlling mold spore levels in homes has been a recommended allergy practice for years. This has resulted in numerous legal cases. In the Boston Globe on Nov. 25, 2003, an article quoted the Insurance Information Institute as saying “While the exact number of such cases cannot be determined, the estimates are that legal claims involving mold have tripled nationwide in the last three years, with $3 billion paid out in homeowners policies last year for mold-related cases, up from $1.4 billion in 2001. In 1999, such claims were virtually nonexistent.” F. THE START OF CURRENT MOLD PROBLEMS IN THE UNITED STATES In the United States, the 1970’s saw the extensive use of drywall (gypsum board with paper on both sides) in both residential and commercial construction. This was mainly because drywall construction costs 50% less than plaster construction. Thus began the introduction of “mold friendly” building materials into homes, commercial, and industrial buildings. The paper and glues in drywall are organic materials that can support mold growth when they become wet. Plaster, on the other hand, contains very little organic matter to retain water or to support mold growth (Occasionally, horsehair and cellulose can be found in the rough coat.) Plaster also has a final coat of ‘lime plaster’ which is mostly calcium hydroxide. Lime plaster is very alkaline when wet, which further inhibits microbial growth. Therefore, drywall is much more “mold friendly” than plaster. The next factor in the start of the mold problem was energy market manipulation in the mid 1970’s. The oligopolistic major oil companies induced a fabricated “oil shortage” by holding imported oil in tankers off shore and creating a so-called “energy crisis.” This contrived oil shortage was similar to the one created in the early 1920’s (see newspapers of that time for references). The prior contrived shortage also resulted in significantly increasing oil prices and corporate profits. This also ushered in an era of “energy conservation” in the US. Note: Another example of “repeating history when we failed to learn from it” occurred in the area of ventilation standards. In December 1981, in response to the contrived “energy crisis” mentioned above, the American Society of Heating, Refrigeration and Air Conditioning Engineers (ASHRAE) reduced the required amount of outside make-up air from 15 cfm per person to only 5 cfm per person. This ventilation standard (ASHRAE 62-1981) clearly disregarded earlier research that showed a health risk from low ventilation rates. Shortly thereafter, the indoor air quality /sick building problems of the 1980’s began to surface. In January of 1983, ASHRAE rescinded its 62-1981 standard due to “health concerns.” Worse yet, thousands of buildings continued to be built a number of years after that using the unhealthful ASHRAE 62-1981 for. The main reason for this continued unhealthy construction was the common practice in the US of using the “low bidder.” Mechanical engineering firms would win contracts by being the low bidder using the ventilation system requirements of ASHRAE 62-1981 (5 cfm/person) over the higher bids of competing companies using the correct, older ventilation requirements of ASHRAE 62-1976 (15 cfm/person). Professional mechanical engineers, even though they were aware of the “health concerns” statement by ASHRAE, were under no “legal” duty to inform prospective building owner of the unhealthiness of 62-1981, since this is only a guideline. As the same time, few building owners were unaware that ASHRAE had retracted the newer standard. Consequently, the practice of building poorly-ventilated buildings continued throughout the 1980’s until the formal reissuing of this standard by ASHRAE in 1989. Many local government code bodies, also unaware that ASHRAE had rescinded the 62-1981 standard, continued to specify these unhealthful ventilation rates until 1990. Consequently, many homes and commercial buildings built during that decade were “tightened up” to reduce heating and cooling costs. Insulation standards increased and infiltration rates were decreased. The consequence of this was that when drywall became wet, due to decreased wall air infiltration and less ventilation of moisture-ladened air, it did not dry out as quickly as it did in the past. Mold growth became a problem after even relatively minor water intrusion events. Two of the major studies of the relationship of indoor mold to occupant illness in homes were conducted in the Netherlands 352 and Taiwan 336 in the early 1990’s. Neither of these studies found a directly relationship between reported symptoms and mold spore levels. However, the reporting of “damp” conditions in the home clearly was related to an increased risk of respiratory disease. In the 1990’s, the potential health implications of indoor mold growth were finally broadly recognized in the United States. Further, buildings containing “mold-friendly” building materials were now widespread throughout the United States. Interestingly, Germany, Poland, Columbia, the Czech Republic, Slovakia and many other countries still require the use of plaster instead of drywall and coincidently do not have as many mold problems as are found in the United States. Note: An interesting story regarding to the use of plaster occurred in 2000 when the Czech Republic experienced extensive flooding. The AIHA contacted officials in that country and offered them help with mold problems resulting from the flooding. The officials wrote back to the AIHA and said they had very little mold problems from the flooding because they don’t use drywall.
|
|||||||||||||||||||||||||||||||||||||||||||||||||||||||||||||||||||||||||||||||||||||||||||||||||||||||||||||||||||||||||||||||||||||||||||||||||||||||||||||||||||||||||||||||||||||||||||||||||||||||||||||||||||||||||||||||||||||||||||||||||||||||||||||||||||||||||||||||||||||||||||||||||||||||||||||||||||||||||||||||||||||||||||||||||||||||||||||||||||||||||||||||||||||||||||||||||||||||||||||||||||||||||||||||||||||||||||||||
|
>>
Back to Mold
>>
Home
|
|||||||||||||||||||||||||||||||||||||||||||||||||||||||||||||||||||||||||||||||||||||||||||||||||||||||||||||||||||||||||||||||||||||||||||||||||||||||||||||||||||||||||||||||||||||||||||||||||||||||||||||||||||||||||||||||||||||||||||||||||||||||||||||||||||||||||||||||||||||||||||||||||||||||||||||||||||||||||||||||||||||||||||||||||||||||||||||||||||||||||||||||||||||||||||||||||||||||||||||||||||||||||||||||||||||||||||||||